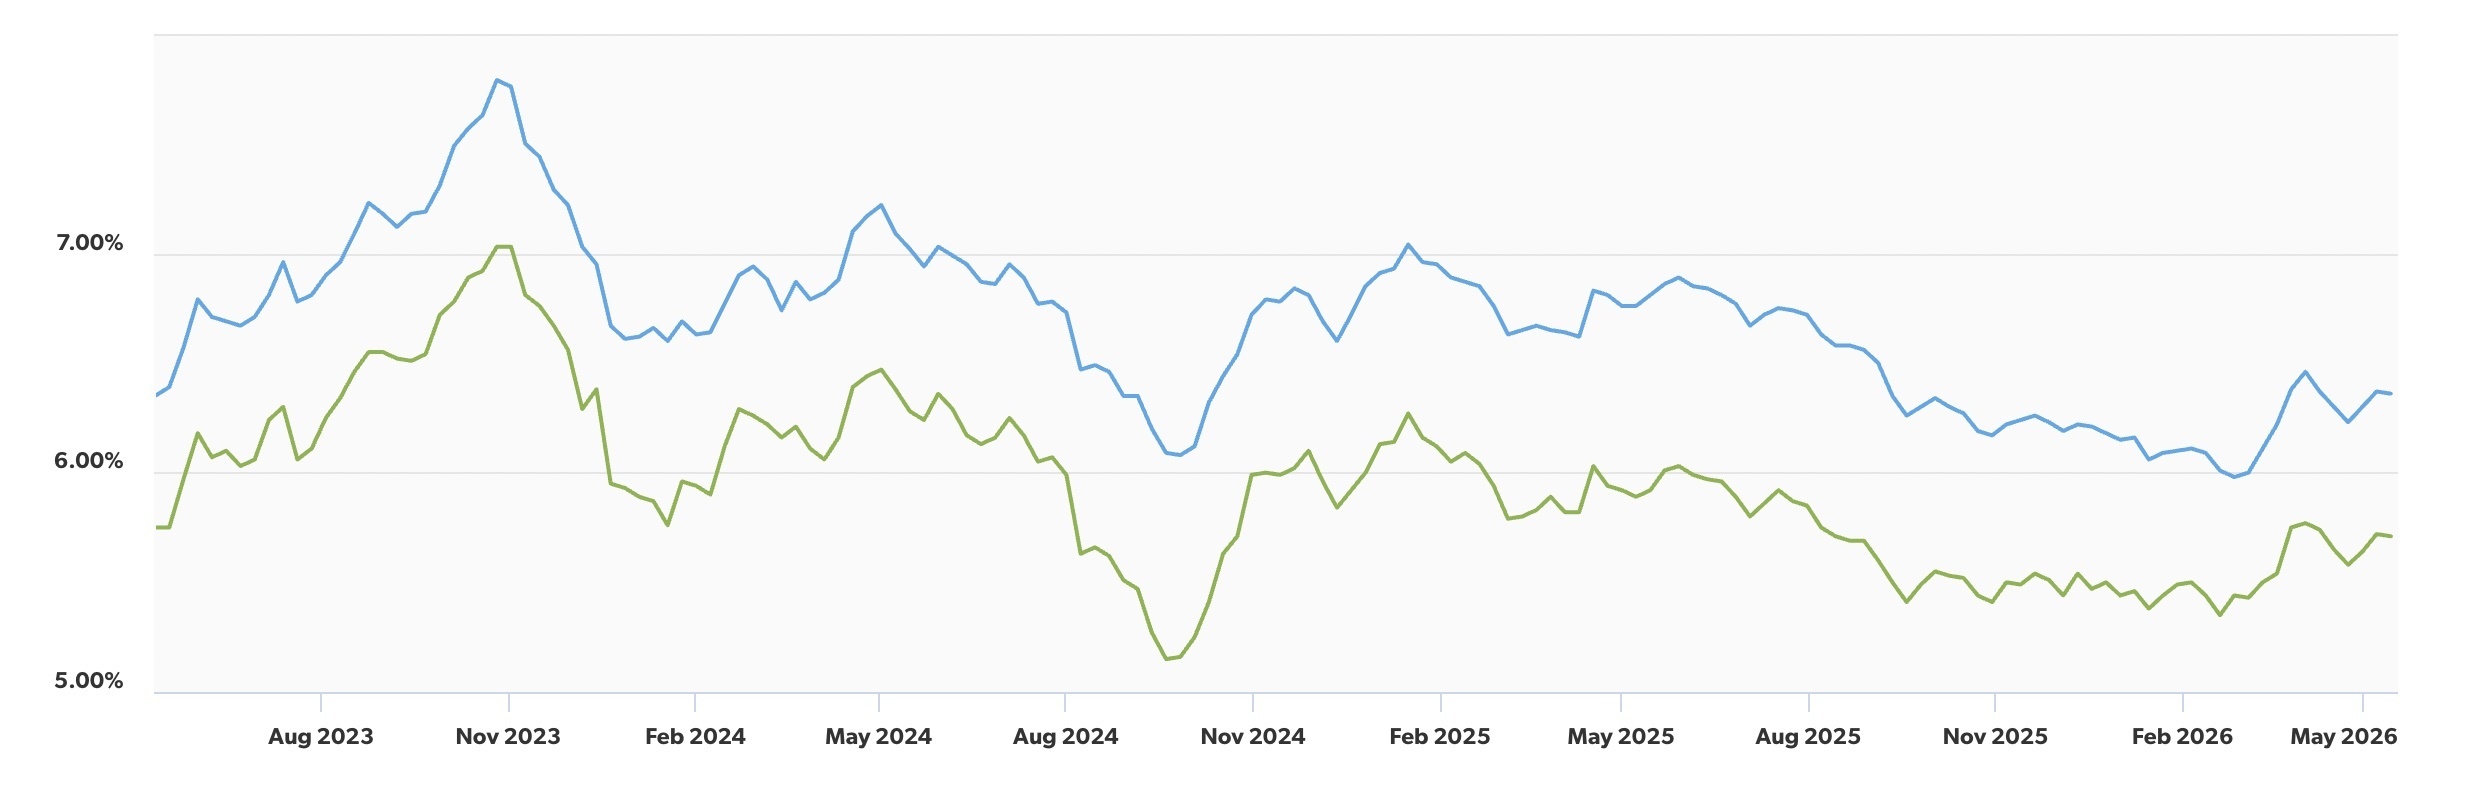
While mortgage rates have remained volatile over the past several months, they are actually lower this spring homebuying season than they were during the same period in each of the last three years. That may come as a surprise given the constant headlines around inflation and interest rate uncertainty. Chart 1 tracks both the 30-year fixed-rate mortgage (blue) and the 15-year fixed-rate mortgage (green) over the last three years. As of May 14, the average 30-year fixed rate stood at 6.36%, notably lower than May 2025’s 6.81%, May 2024’s 7.02%, and even slightly below May 2023’s 6.39%.
In other words, while rates may still feel elevated compared to the ultra-low-rate era, today’s buyers are increasingly adapting to this environment, and many are choosing to move forward rather than continue waiting on the sidelines. (Freddie Mac)
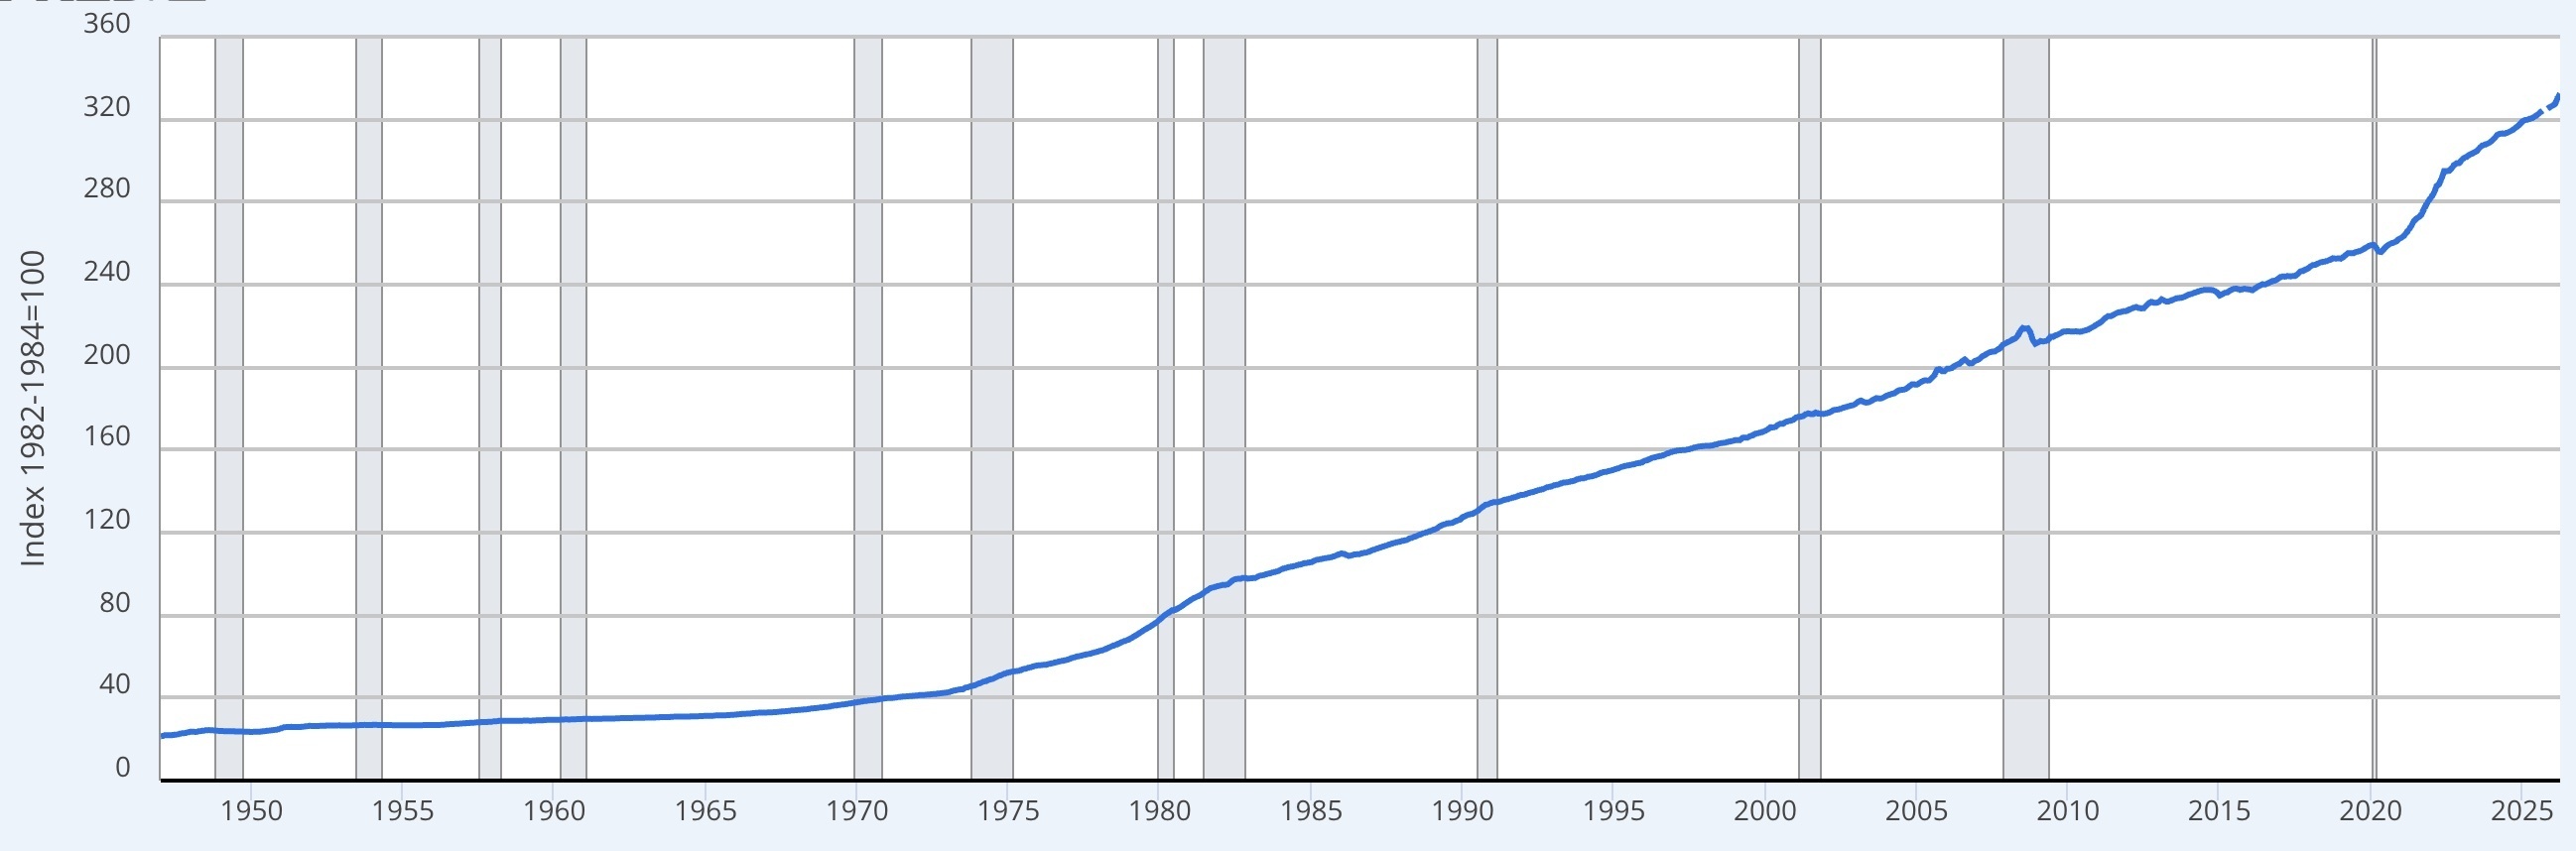
The Consumer Price Index (CPI) tracks changes in the cost of everyday goods and services and is one of the most widely used measures of inflation. This month’s inflation report (3.8 in April, up from 3.3 in March and 2.4 in February) reinforced concerns that interest rates could remain elevated for longer, while this chart highlights the sharp surge in consumer prices beginning in 2021 and the lasting impact inflation continues to have on borrowing costs and buyer confidence. (Federal Reserve Bank of St. Louis)
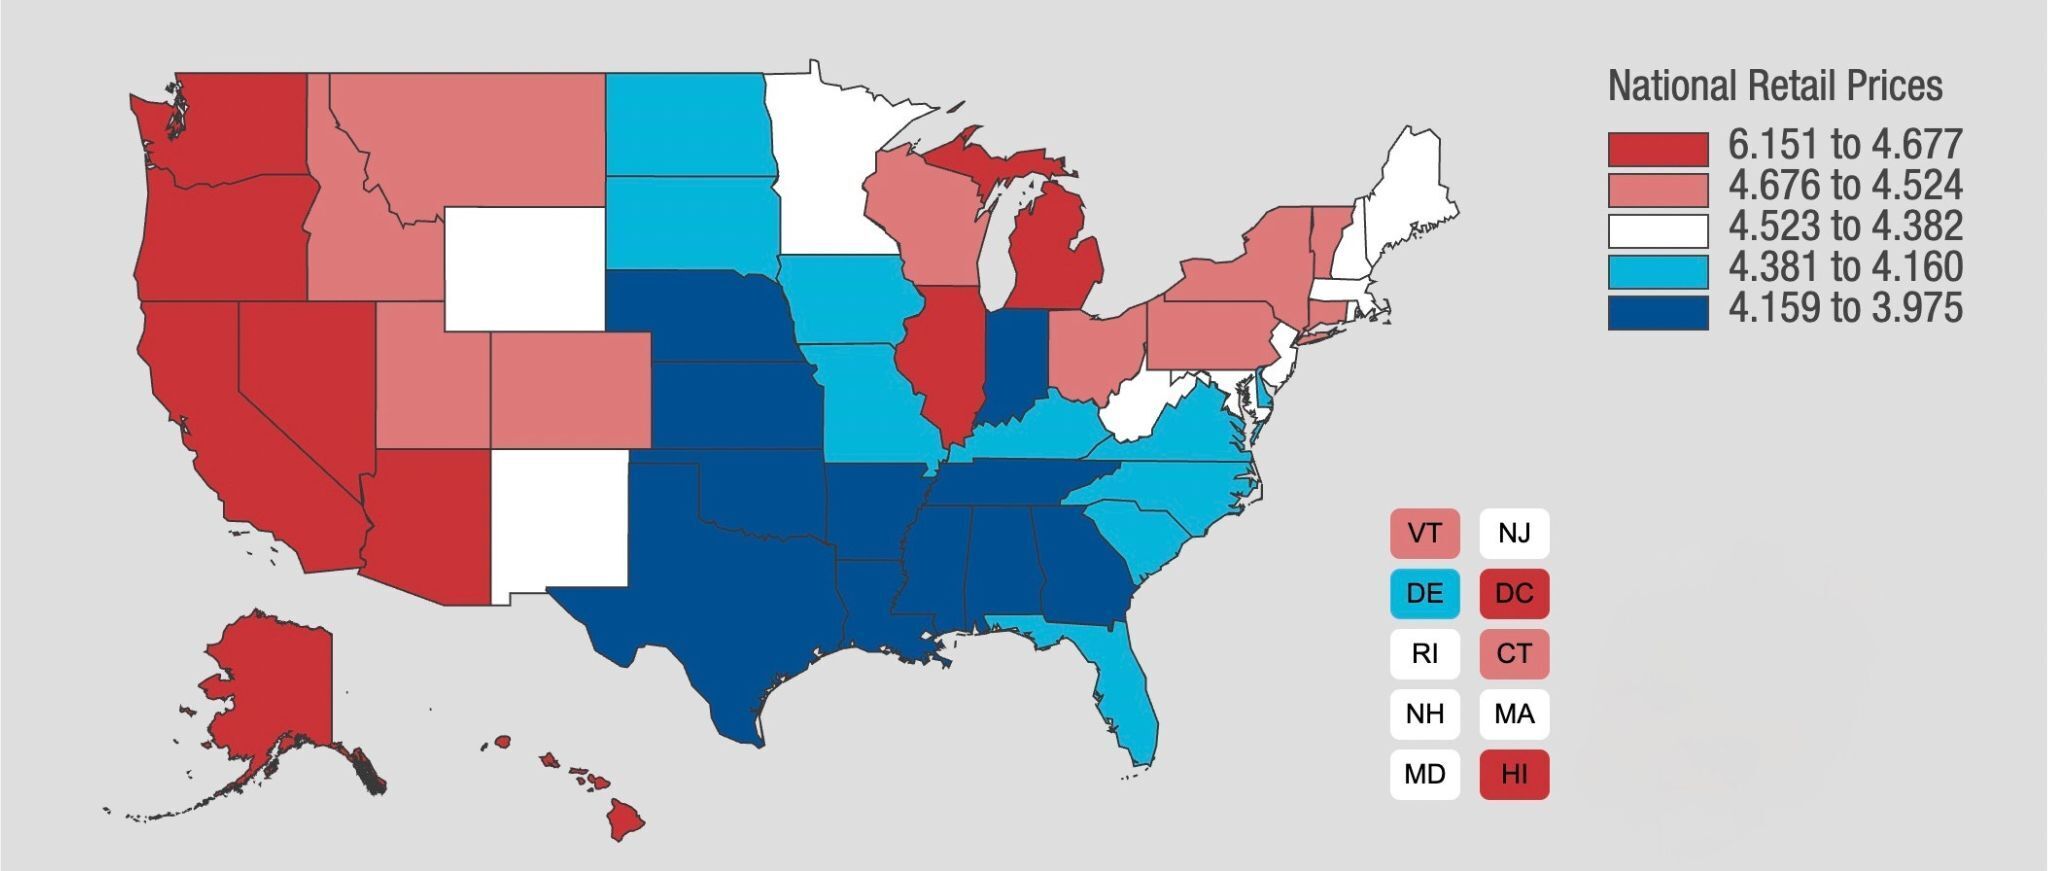
While the CPI tracks the cost of a broad basket of goods and services, gas prices remain one of the most closely watched inflation indicators. As this map illustrates, fuel prices have climbed sharply across much of the country amid ongoing volatility in global oil markets and heightened tensions surrounding the war in Iran. (American Automobile Association)
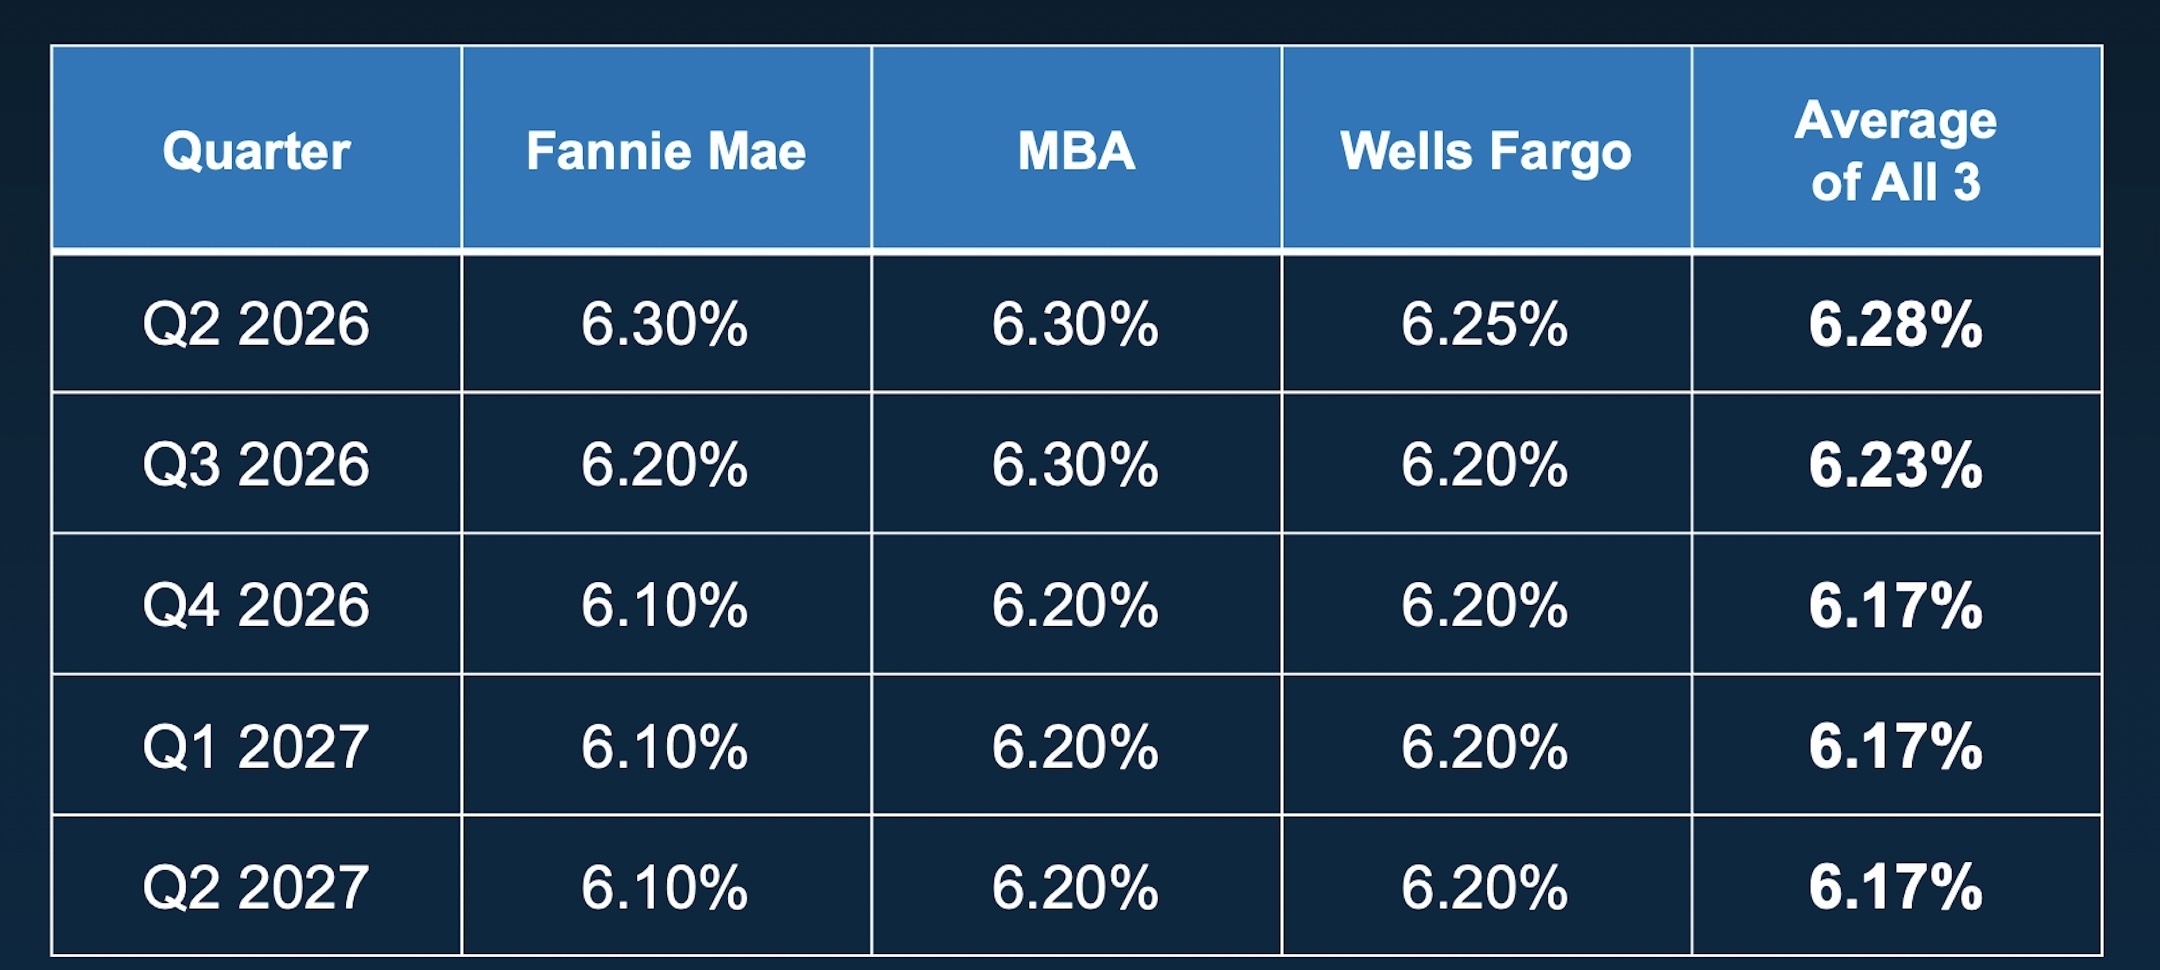
Despite recent inflation concerns and ongoing market volatility, most major forecasters still expect mortgage rates to gradually ease over the next year. As this chart shows, projections from Fannie Mae, the Mortgage Bankers Association, and Wells Fargo all anticipate 30-year fixed rates settling into the low-6% range through 2026 and early 2027. (Keeping Current Matters)
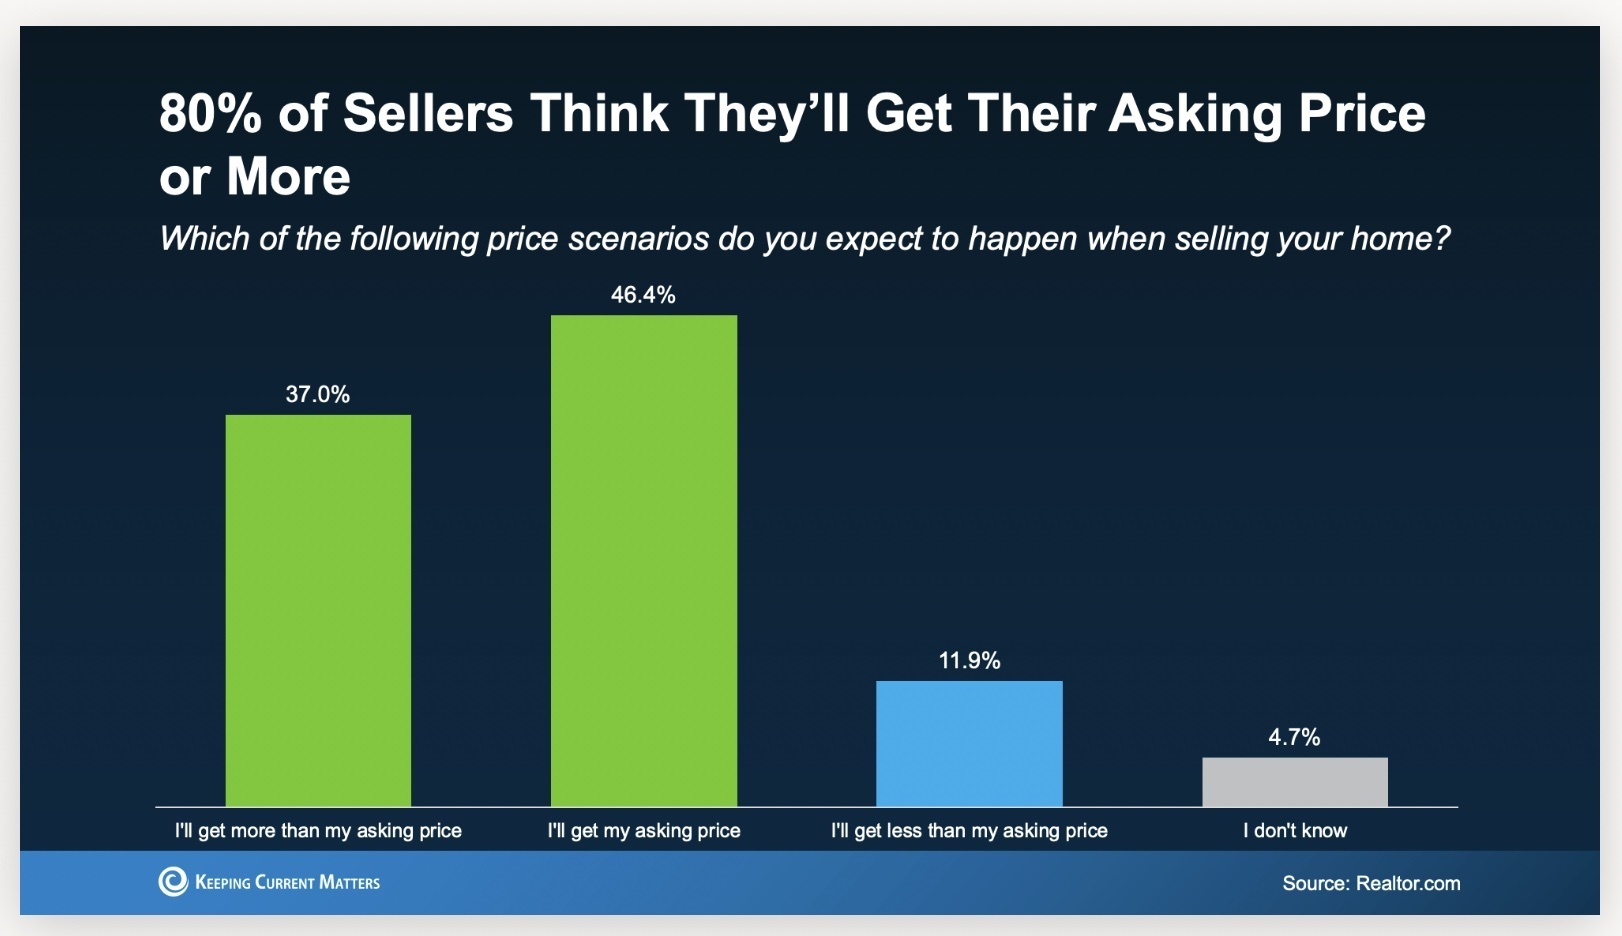
Despite economic uncertainty tied to the Iran conflict and softer consumer sentiment, most sellers across the country remain extremely optimistic this spring. A recent Realtor.com survey found that 83% of sellers expect to achieve their asking price or higher, and three-quarters believe their homes will sell within four months. (Realtor.com)
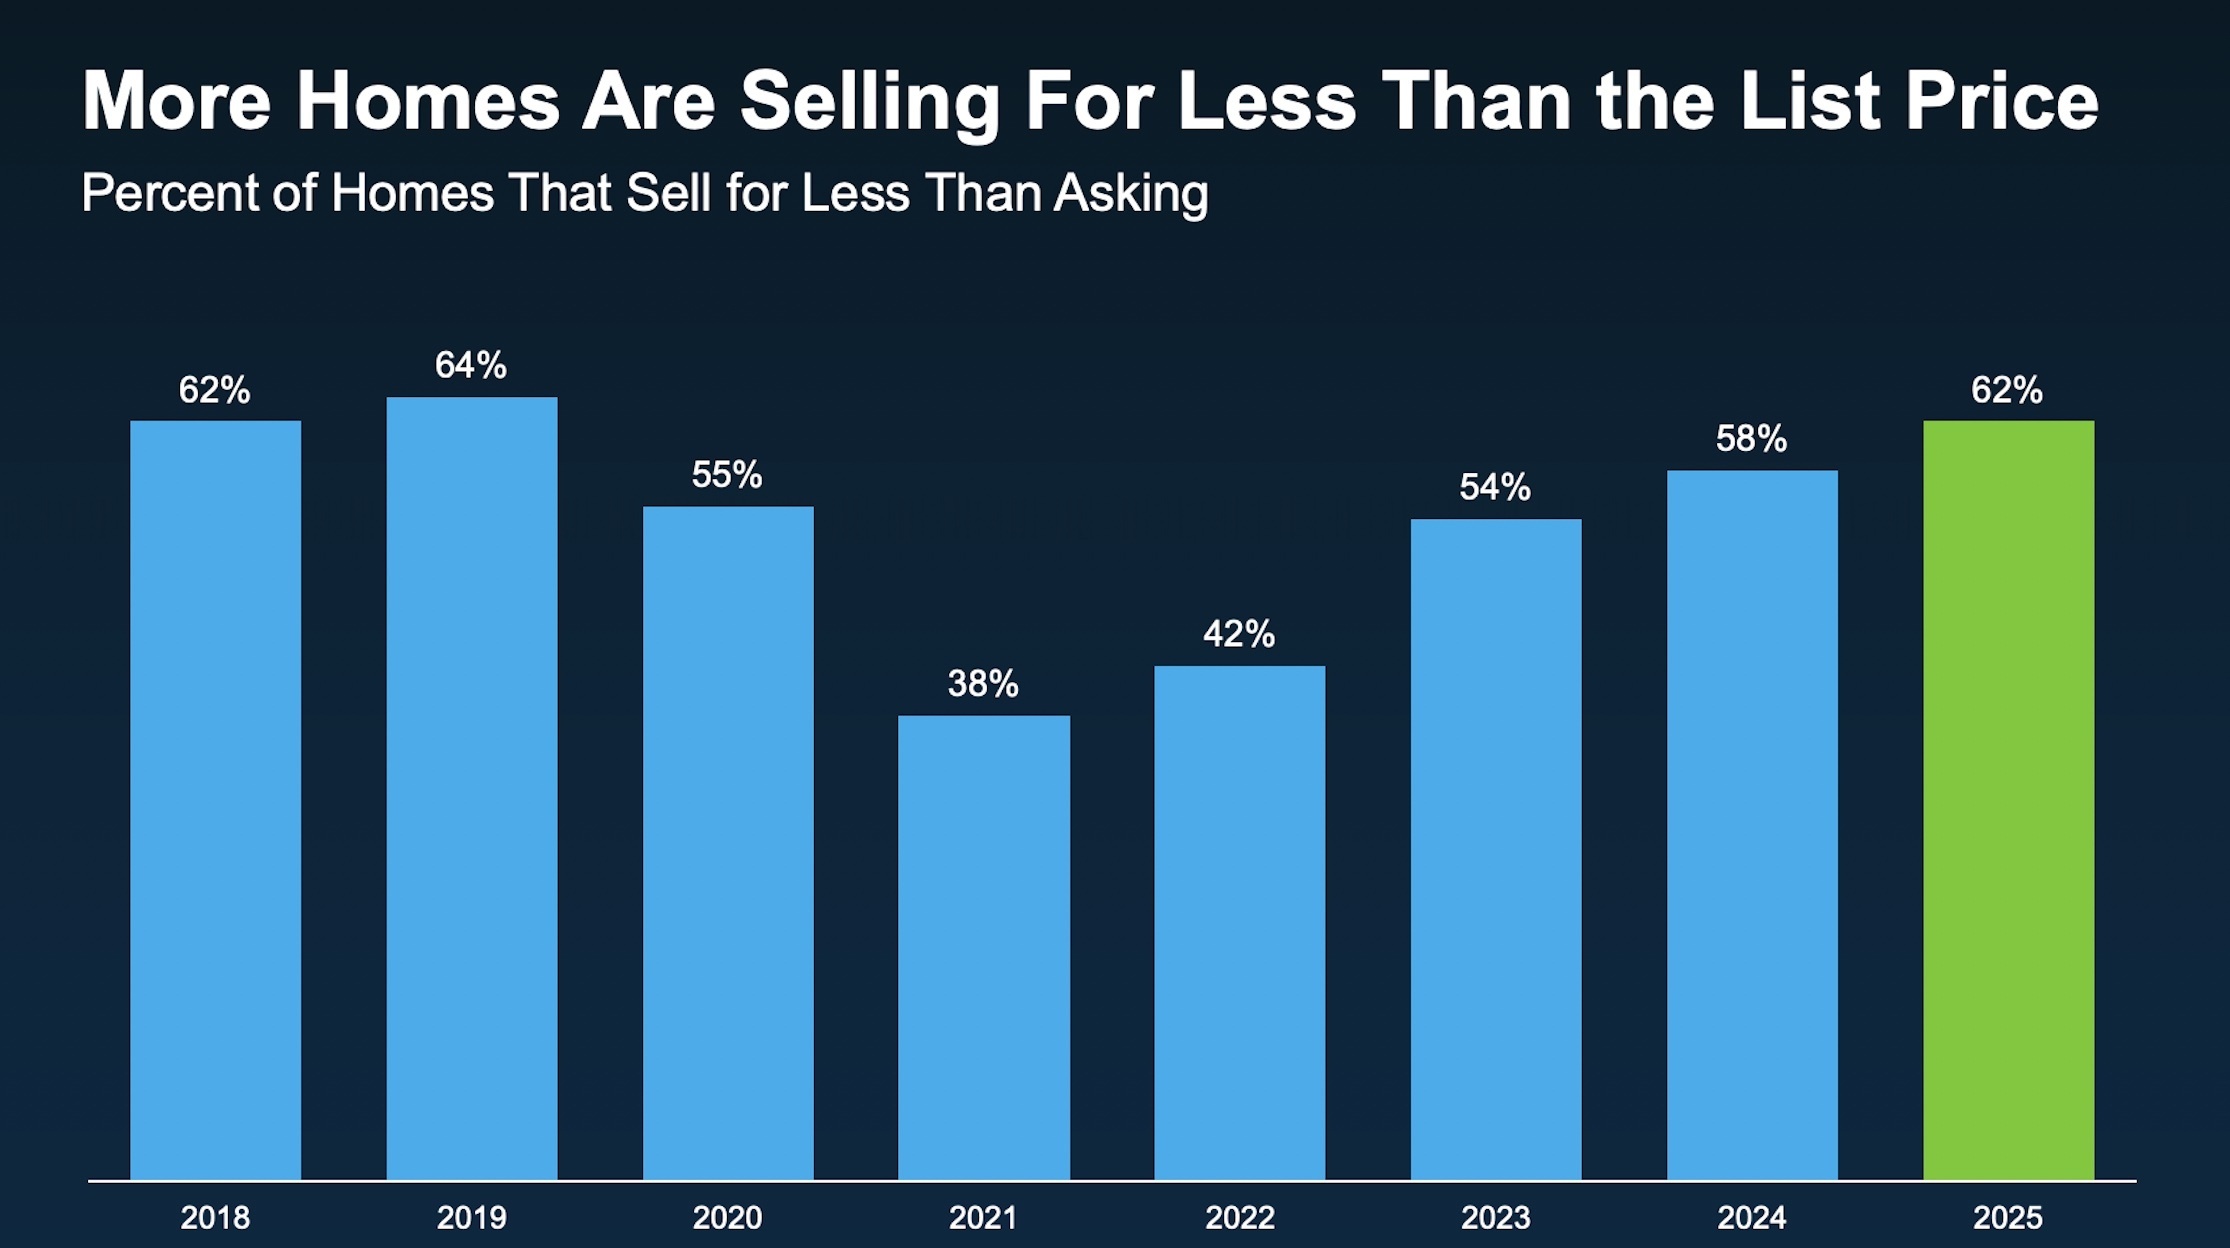
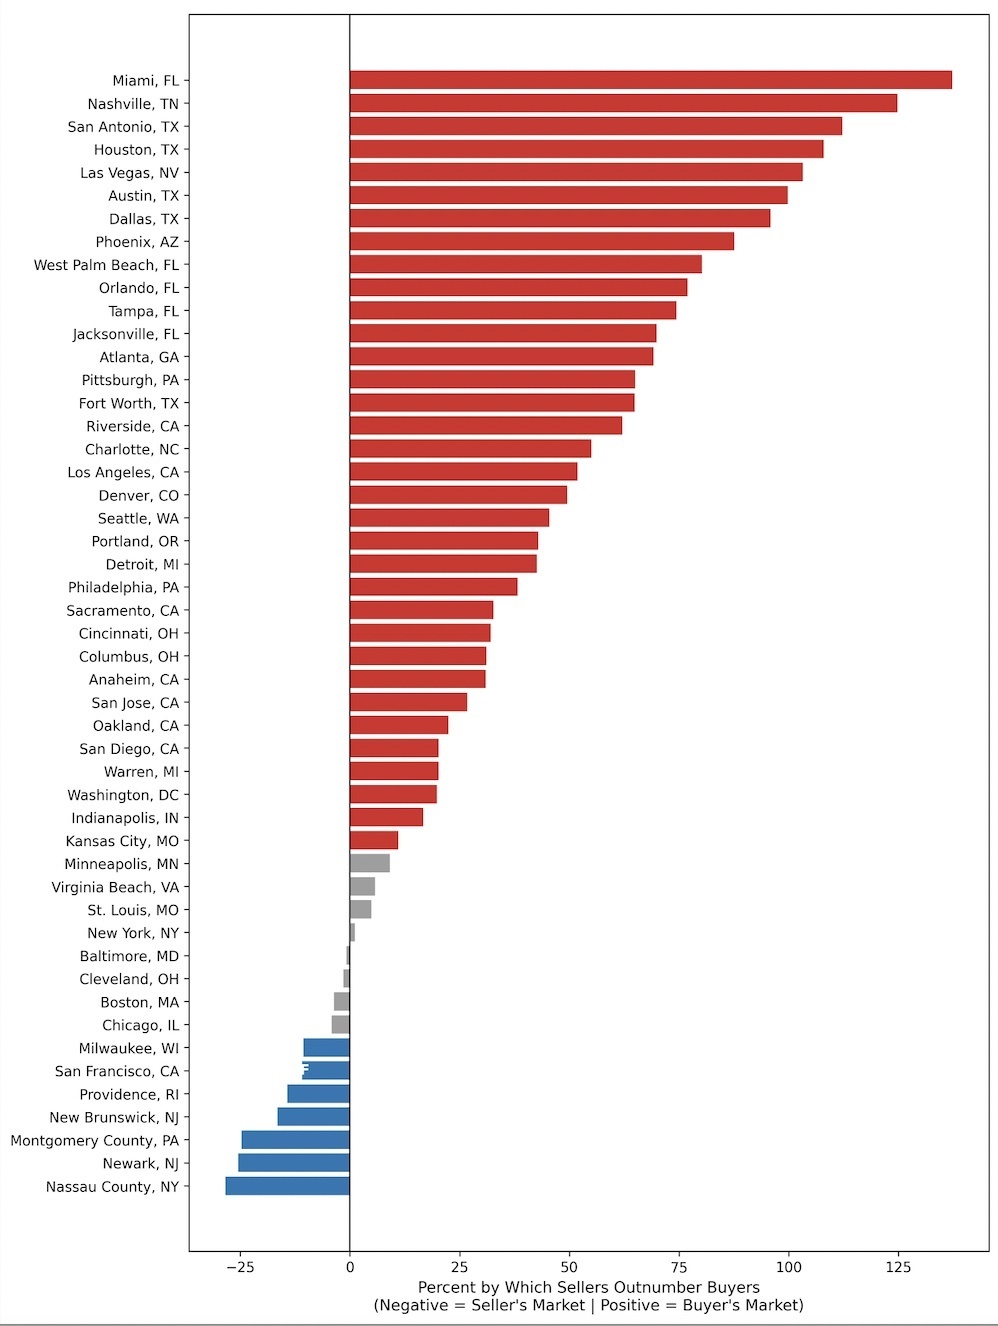
Despite continued seller optimism, the broader data tell a more nuanced story. Across much of the country, an increasing number of homes are selling below asking price, and most major U.S. metros are now considered buyer’s markets. The two charts below illustrate both the growing share of homes selling under list price and the balance of power across the nation’s 50 largest metro areas, with San Francisco standing out as one of only seven metros that still currently favor sellers. (Redfin, ResiClub, Keeping Current Matters)
Despite continued seller optimism, the broader data tell a more nuanced story. Across much of the country, an increasing number of homes are selling below asking price, and most major U.S. metros are now considered buyer’s markets. The two charts below illustrate both the growing share of homes selling under list price and the balance of power across the nation’s 50 largest metro areas, with San Francisco standing out as one of only seven metros that still currently favor sellers. (Redfin, ResiClub, Keeping Current Matters)
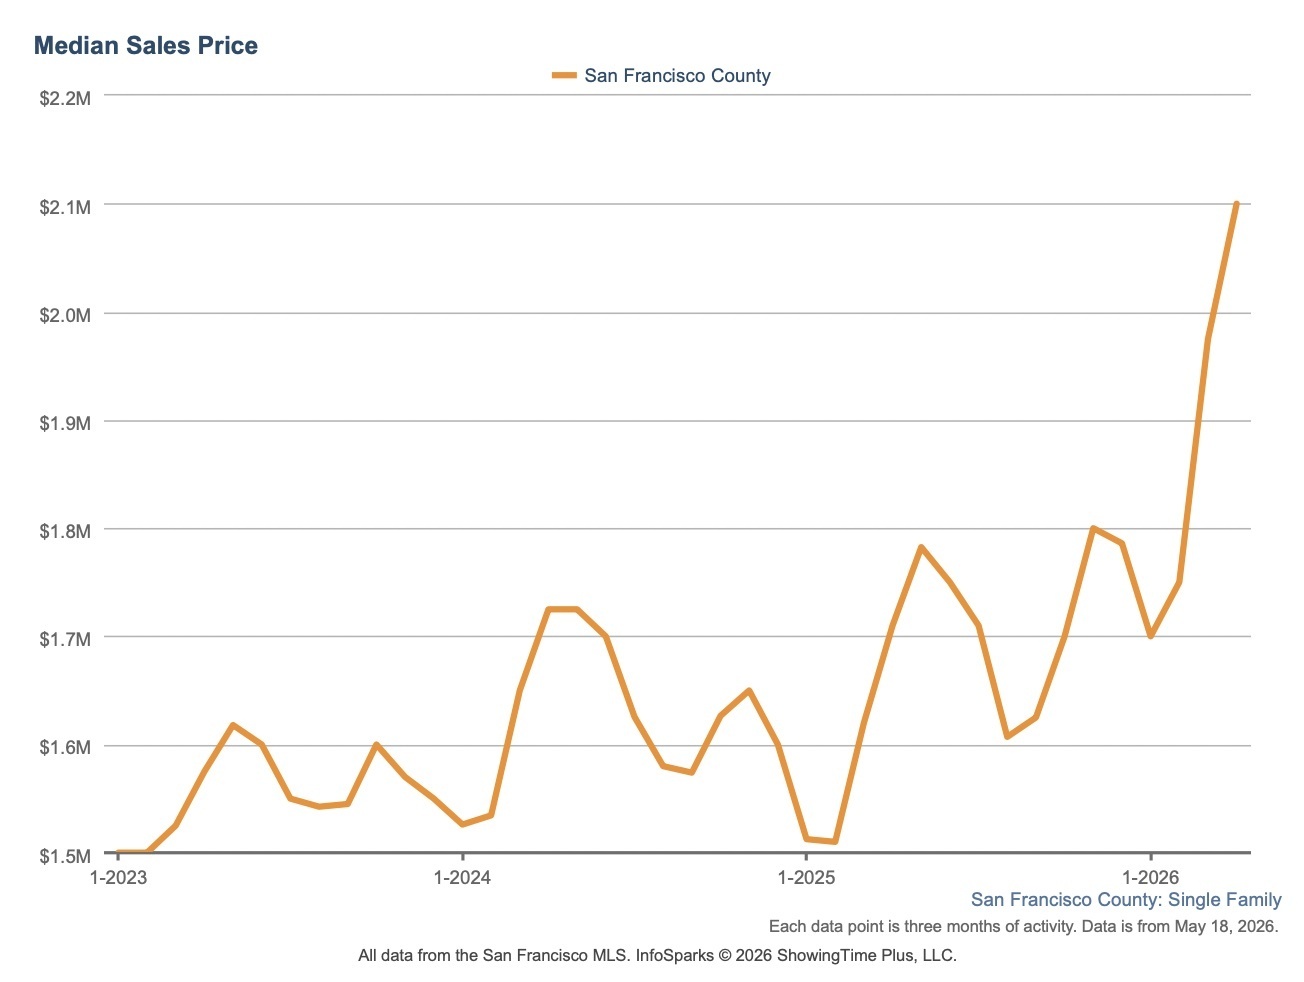
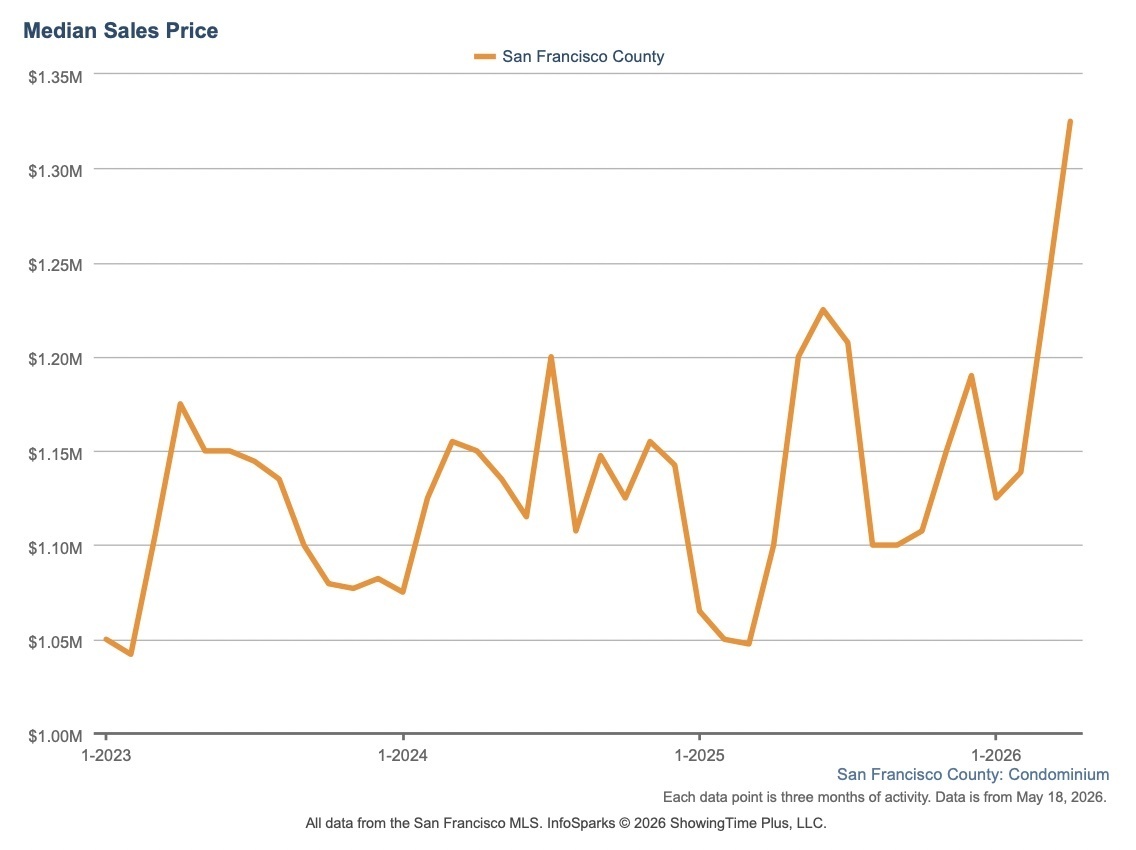
San Francisco home prices continue their remarkable climb, with median single-family home prices rising nearly 23% year-over-year and condo prices up more than 20% (April 2025 to April 2026). The first chart tracks single-family home median sale prices across San Francisco County, with each data point showing three months of activity from January 2023 through April 2026. The second chart tracks median sale prices of San Francisco condominiums in the same time period. (InfoSparks)
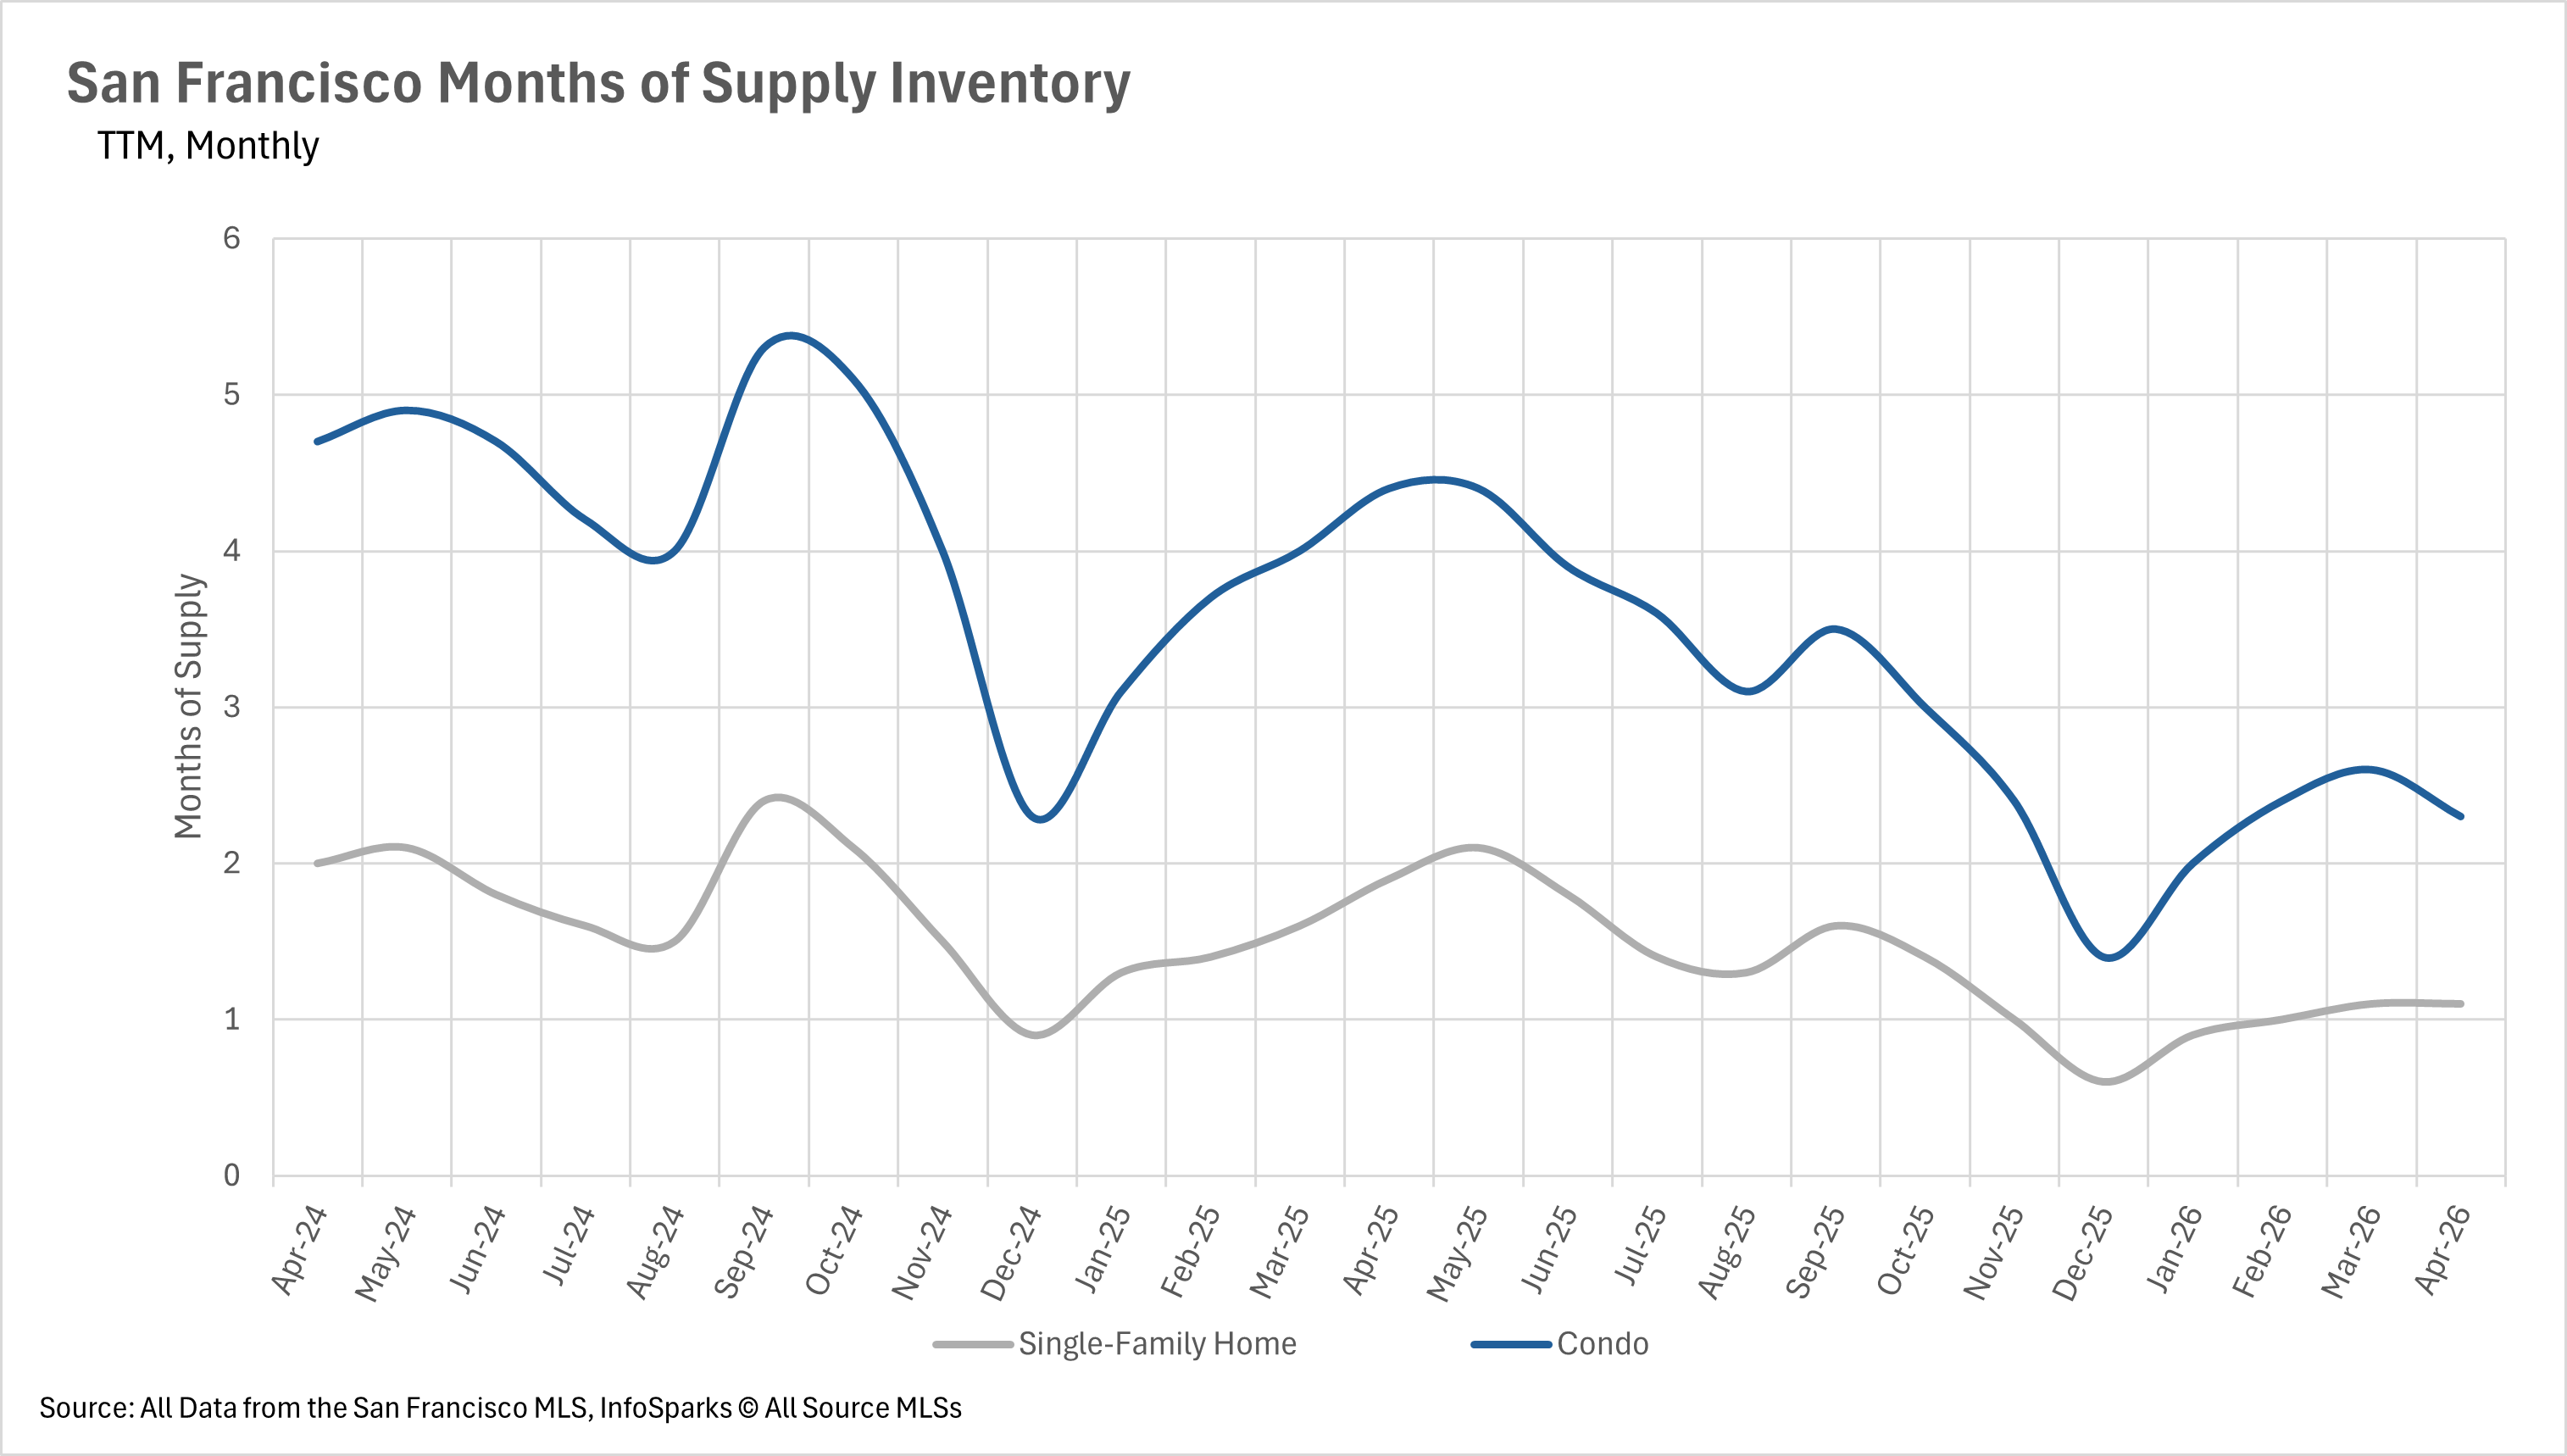
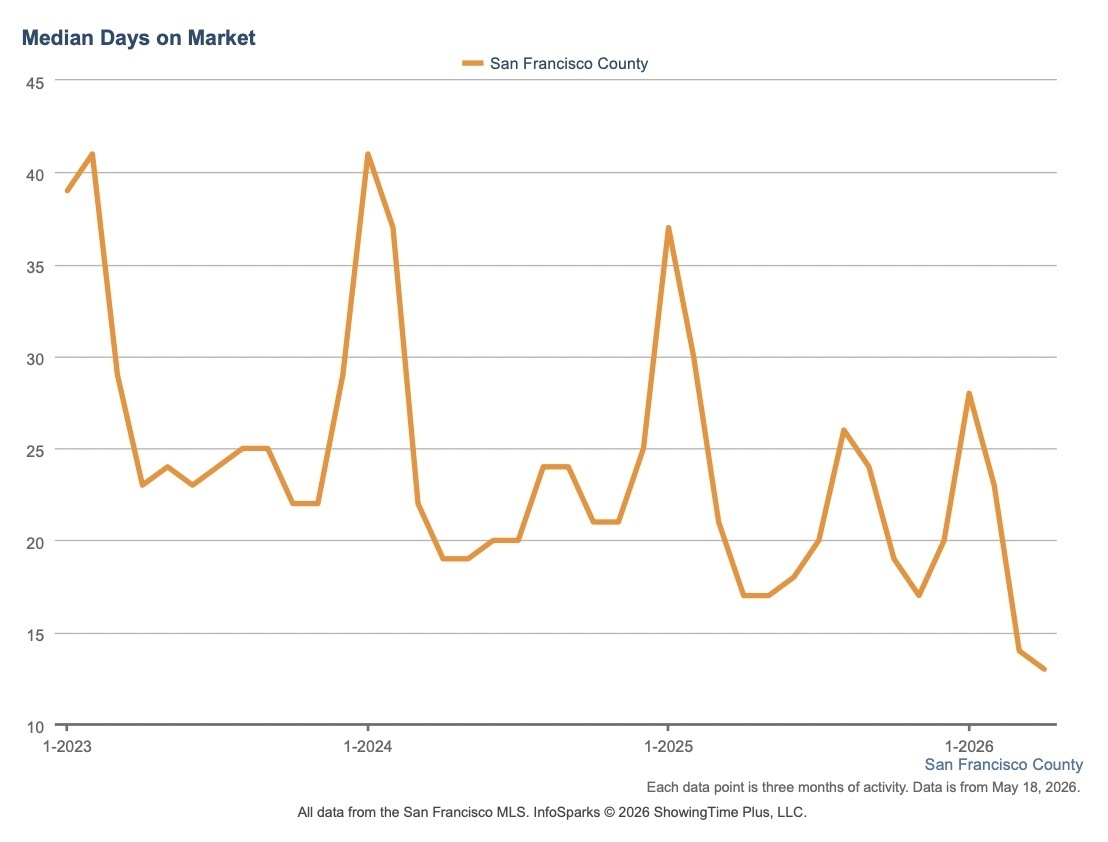
At the same time, inventory remains extraordinarily constrained - still nearly 40% below last year’s levels - keeping competition intense across the city. Well-priced listings are moving at a rapid pace, with median days on market sitting at just 13 days for all residential properties (12 for single-family homes and 14 for condos). (InfoSparks)

Vantage Realty
1980 Union Street
San Francisco, CA 94123
CA DRE# 01515430
Kristan Lynch Ayala